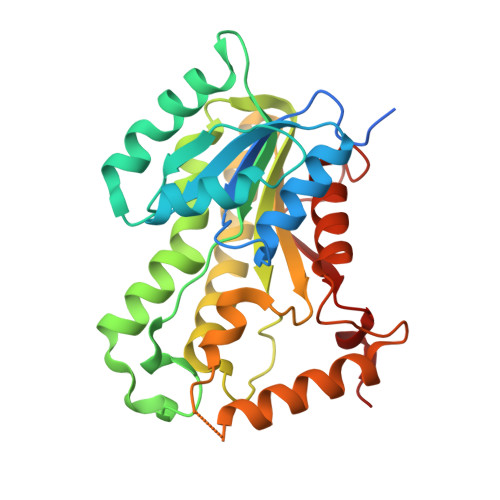
5COQ

The effect of valine to alanine mutation on InhA enzyme crystallization pattern and substrate binding loop conformation and flexibility


Experimental Data Snapshot

  • Method: X-RAY DIFFRACTION
  • Resolution: 2.30 Å
  • R-Value Free: 0.212 
  • R-Value Work: 0.161 
  • R-Value Observed: 0.163 

wwPDB Validation   3D Report Full Report


Ligand Structure Quality Assessment 


This is version 1.3 of the entry. See complete history


Literature

Rational Modulation of the Induced-Fit Conformational Change for Slow-Onset Inhibition in Mycobacterium tuberculosis InhA.

Lai, C.T.Li, H.J.Yu, W.Shah, S.Bommineni, G.R.Perrone, V.Garcia-Diaz, M.Tonge, P.J.Simmerling, C.

(2015) Biochemistry 54: 4683-4691

  • DOI: https://doi.org/10.1021/acs.biochem.5b00284
  • Primary Citation of Related Structures:  
    5COQ, 5CP8, 5CPB, 5CPF

  • PubMed Abstract: 

    Slow-onset enzyme inhibitors are the subject of considerable interest as an approach to increasing the potency of pharmaceutical compounds by extending the residence time of the inhibitor on the target (the lifetime of the drug-receptor complex). However, rational modulation of residence time presents significant challenges because it requires additional mechanistic insight, such as the nature of the transition state for postbinding isomerization. Our previous work, based on X-ray crystallography, enzyme kinetics, and molecular dynamics simulation, suggested that the slow step in inhibition of the Mycobacterium tuberculosis enoyl-ACP reductase InhA involves a change in the conformation of the substrate binding loop from an open state in the initial enzyme-inhibitor complex to a closed state in the final enzyme-inhibitor complex. Here, we use multidimensional free energy landscapes for loop isomerization to obtain a computational model for the transition state. The results suggest that slow-onset inhibitors crowd key side chains on helices that slide past each other during isomerization, resulting in a steric clash. The landscapes become significantly flatter when residues involved in the steric clash are replaced with alanine. Importantly, this lower barrier can be increased by rational inhibitor redesign to restore the steric clash. Crystallographic studies and enzyme kinetics confirm the predicted effects on loop structure and flexibility, as well as inhibitor residence time. These loss and regain of function studies validate our mechanistic hypothesis for interactions controlling substrate binding loop isomerization, providing a platform for the future design of inhibitors with longer residence times and better in vivo potency. Similar opportunities for slow-onset inhibition via the same mechanism are identified in other pathogens.


Macromolecules
Find similar proteins by:  (by identity cutoff)  |  3D Structure
Entity ID: 1
MoleculeChains Sequence LengthOrganismDetailsImage
Enoyl-[acyl-carrier-protein] reductase [NADH]
A, B, C, D
289Mycobacterium tuberculosisMutation(s): 1 
Gene Names: inhA
EC: 1.3.1.9
UniProt
Find proteins for P9WGR1 (Mycobacterium tuberculosis (strain ATCC 25618 / H37Rv))
Explore P9WGR1 
Go to UniProtKB:  P9WGR1
Entity Groups  
Sequence Clusters30% Identity50% Identity70% Identity90% Identity95% Identity100% Identity
UniProt GroupP9WGR1
Sequence Annotations
Expand
  • Reference Sequence
Small Molecules
Ligands 3 Unique
IDChains Name / Formula / InChI Key2D Diagram3D Interactions
NAD
Query on NAD

Download Ideal Coordinates CCD File 
E [auth A],
G [auth B],
I [auth C],
L [auth D]
NICOTINAMIDE-ADENINE-DINUCLEOTIDE
C21 H27 N7 O14 P2
BAWFJGJZGIEFAR-NNYOXOHSSA-N
TCU
Query on TCU

Download Ideal Coordinates CCD File 
F [auth A],
H [auth B],
J [auth C],
M [auth D]
5-HEXYL-2-(2-METHYLPHENOXY)PHENOL
C19 H24 O2
KSWHNTPMGZKIOB-UHFFFAOYSA-N
NA
Query on NA

Download Ideal Coordinates CCD File 
K [auth C]SODIUM ION
Na
FKNQFGJONOIPTF-UHFFFAOYSA-N
Binding Affinity Annotations 
IDSourceBinding Affinity
TCU BindingDB:  5COQ Ki: min: 0.02, max: 114 (nM) from 2 assay(s)
IC50: min: 22, max: 51 (nM) from 3 assay(s)
Experimental Data & Validation

Experimental Data

  • Method: X-RAY DIFFRACTION
  • Resolution: 2.30 Å
  • R-Value Free: 0.212 
  • R-Value Work: 0.161 
  • R-Value Observed: 0.163 
  • Space Group: C 1 2 1
Unit Cell:
Length ( Å )Angle ( ˚ )
a = 126.095α = 90
b = 91.903β = 106.45
c = 102.846γ = 90
Software Package:
Software NamePurpose
CBASSdata collection
HKL-2000data reduction
HKL-2000data scaling
PHENIXrefinement

Structure Validation

View Full Validation Report


Ligand Structure Quality Assessment 


Entry History 

Deposition Data

Revision History  (Full details and data files)

  • Version 1.0: 2015-08-05
    Type: Initial release
  • Version 1.1: 2015-08-12
    Changes: Structure summary
  • Version 1.2: 2017-11-22
    Changes: Derived calculations, Refinement description
  • Version 1.3: 2024-03-06
    Changes: Data collection, Database references